Your first Signal
Find your way around a Signal: choosing a Signal, Home, the left menu, filters and dashboard pages.
A Signal is where your dashboards and data are. This page shows where things are the first time you open one.
Choose a Signal#
The page Your organisation lists your organisation's Signals. Search for one by name, or browse All signals as cards or as a list.
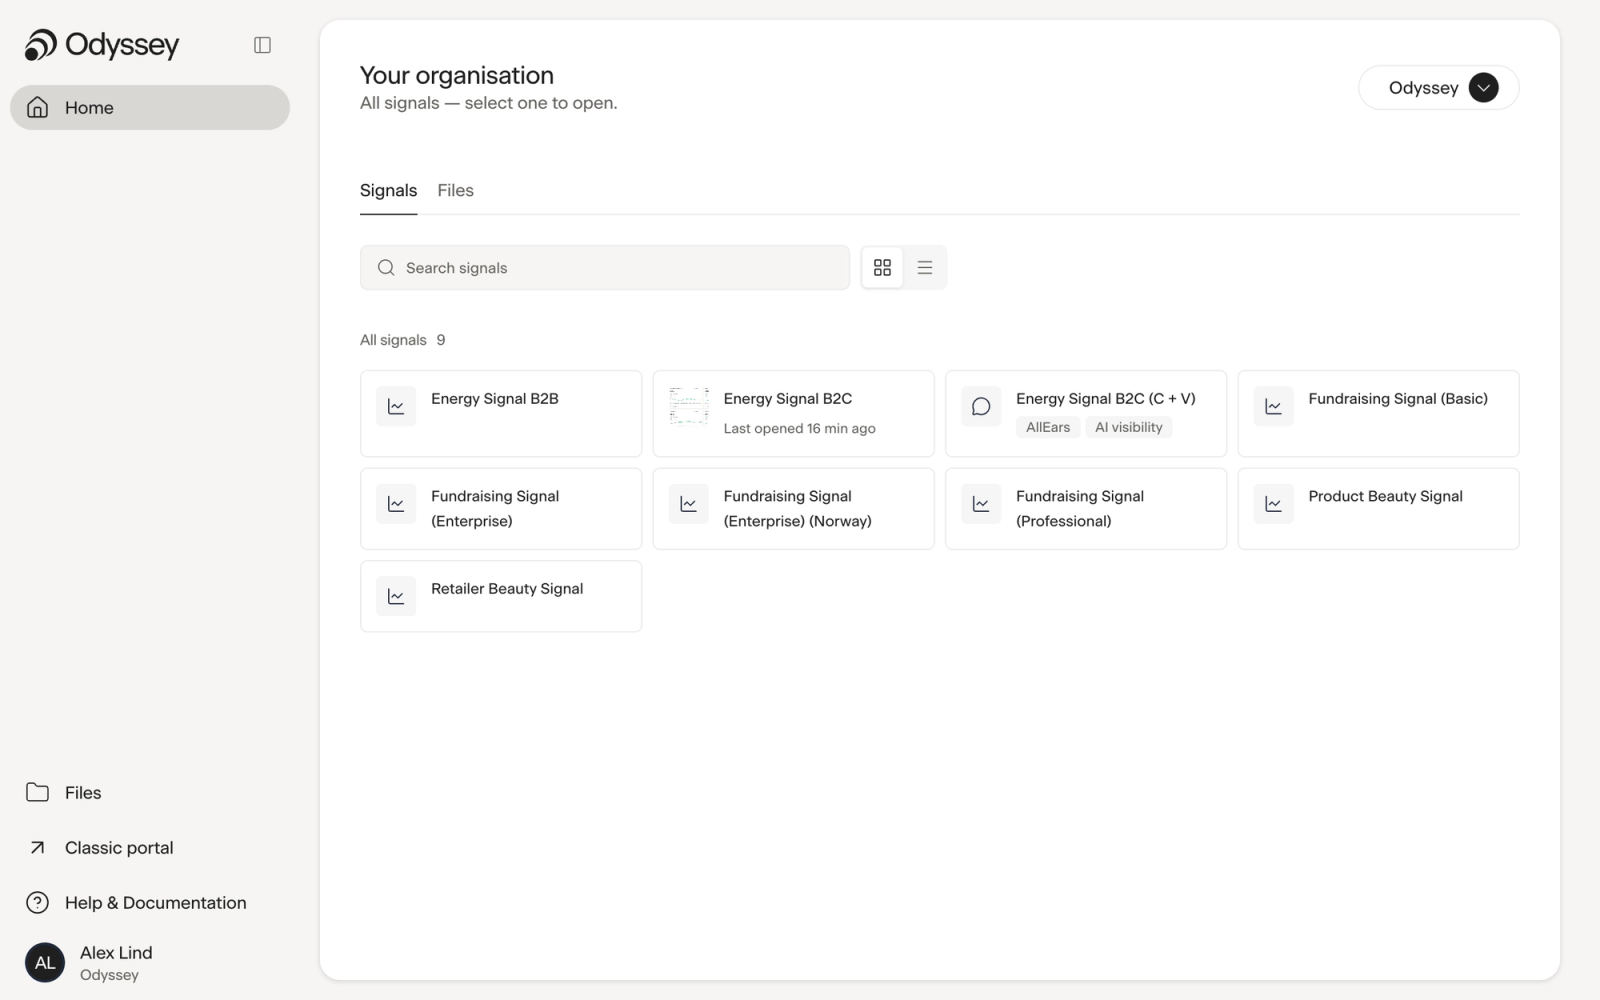
If you belong to more than one organisation, choose another in the organisation menu at the top right of the page. Inside a Signal, select the Signal's name at the top of the left menu to switch to another Signal or organisation.
Home#
A Signal opens on Home. It shows the latest data period, your saved views, what you looked at recently, what you pinned, your conversations with MixerMind and new slides. The checklist Get the most out of Odyssey walks you through the first steps: take the tour, ask MixerMind a question, open a dashboard, save a view, pin to Home and make slides.
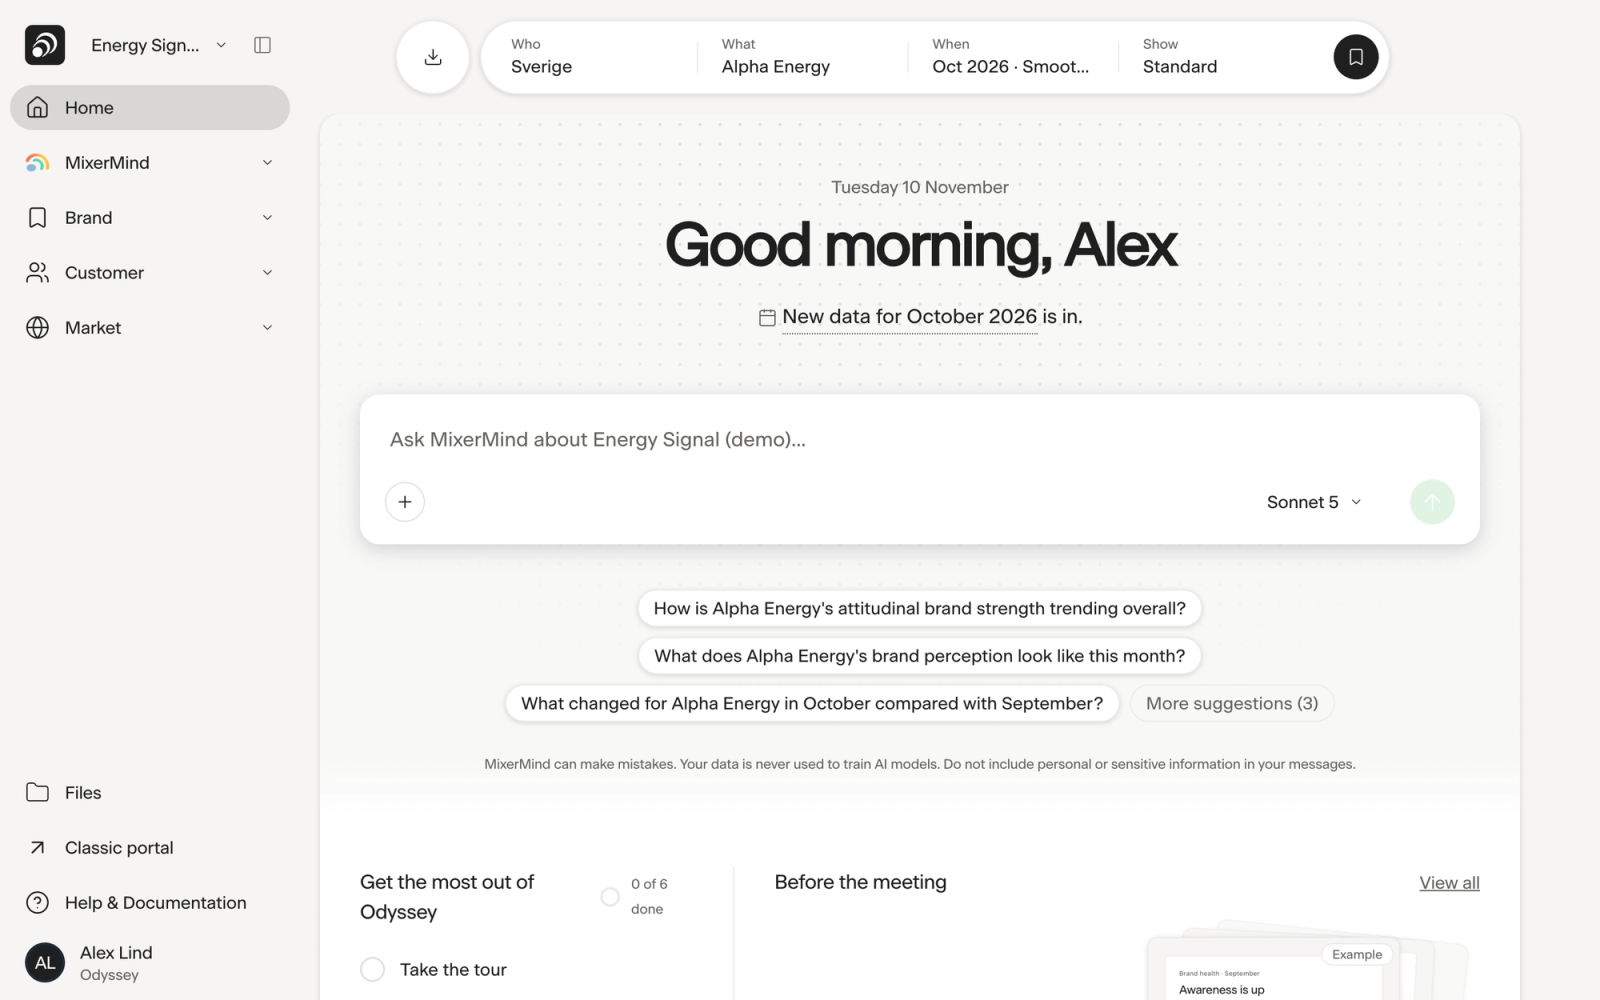
To open the dashboards instead of Home, open My Preferences and set Start page to Dashboard.
The left menu#
| Item | What it is |
|---|---|
| Home | Your start page in the Signal. |
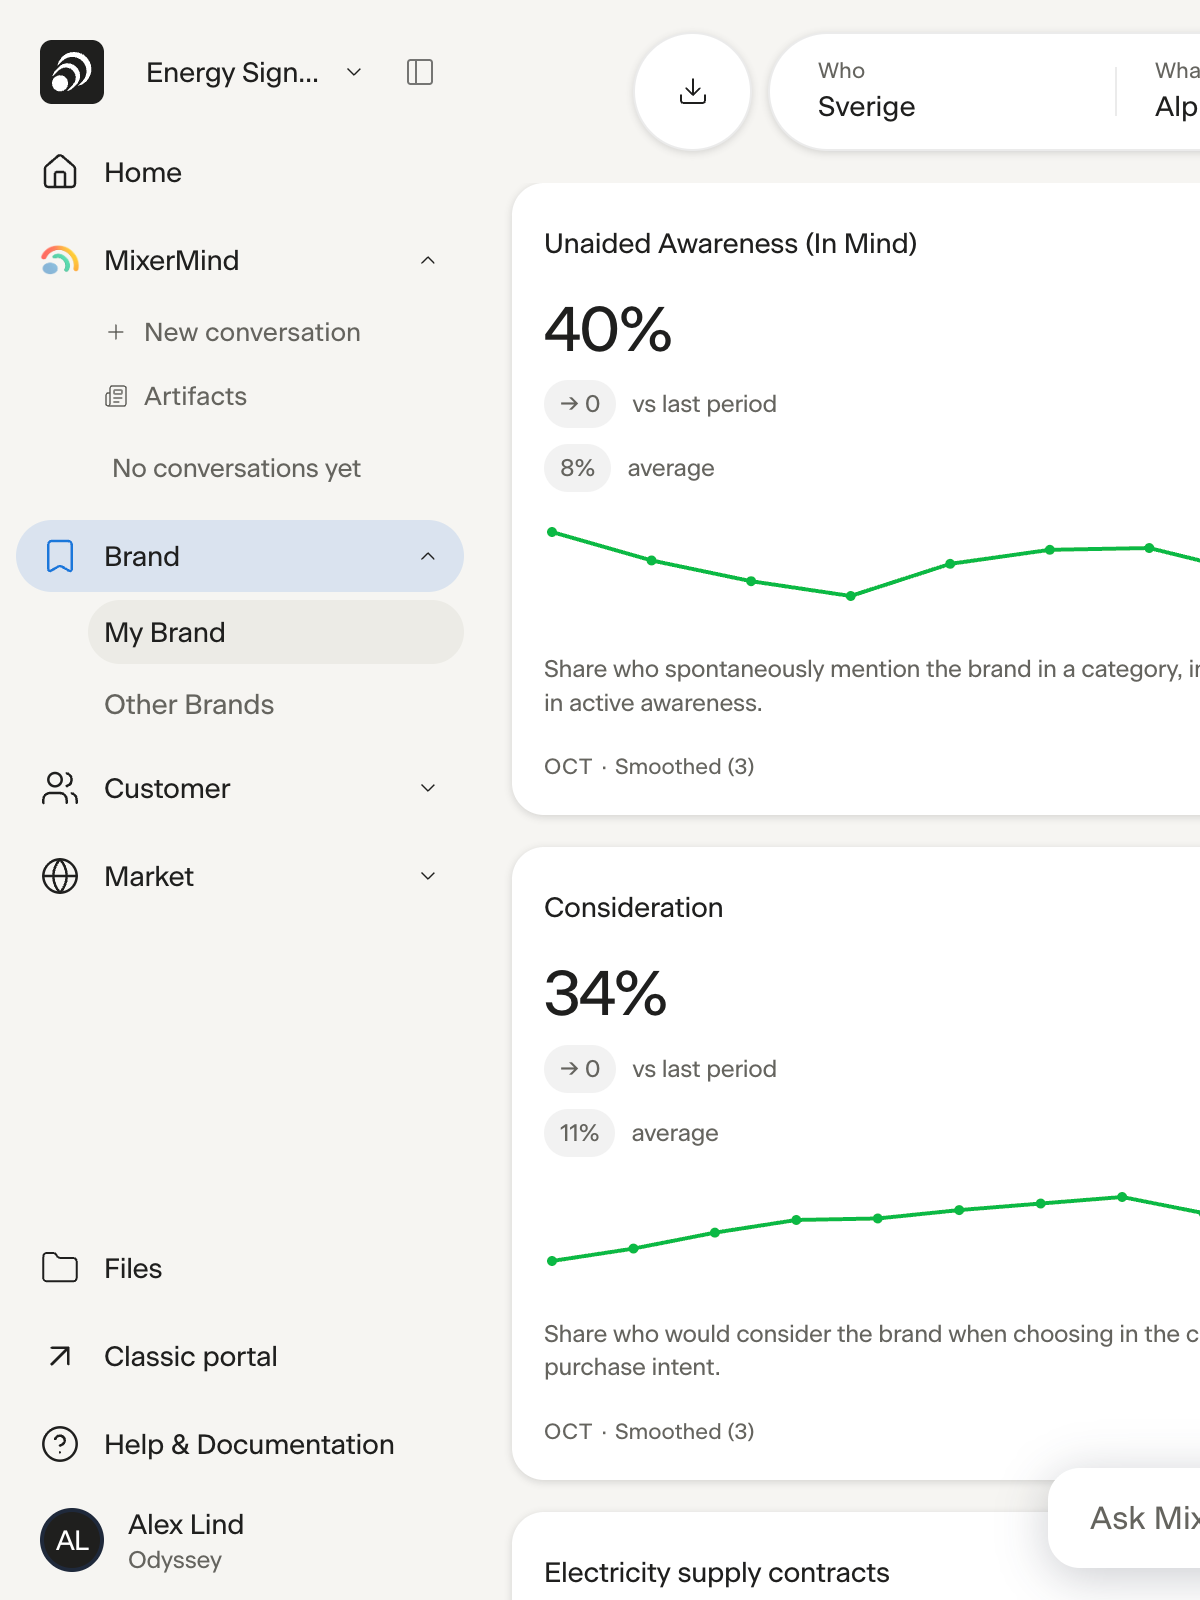
| MixerMind | Start a new conversation, open your earlier conversations, and find what MixerMind made for you under Artifacts. |
| Sections and pages | Your Signal's dashboards. Odyssey names them when it sets up your Signal, so they differ between Signals. |
| Visibility and Conversations | Pages for AI visibility and spoken media, when your organisation has them. |
| Classic portal | Opens the same page in the classic portal. |
Filters#
Above the widgets is a bar with what the page shows. Select a part of it to change it:
| Part | What you choose |
|---|---|
| Who | The markets, and segments that narrow the answers, such as demographics or buyer profile. |
| What | The product or category. |
| When | The period, and how figures are smoothed over time. |
| Show | How figures are shown: Standard, or Custom once you have changed it. |
To keep a combination you use often, select Save view. Your saved views are listed on Home.
A dashboard page#
A page is made of widgets: charts, KPI cards and tables. The filters in the bar above apply to the whole page. Open a KPI card to see its trend over time.
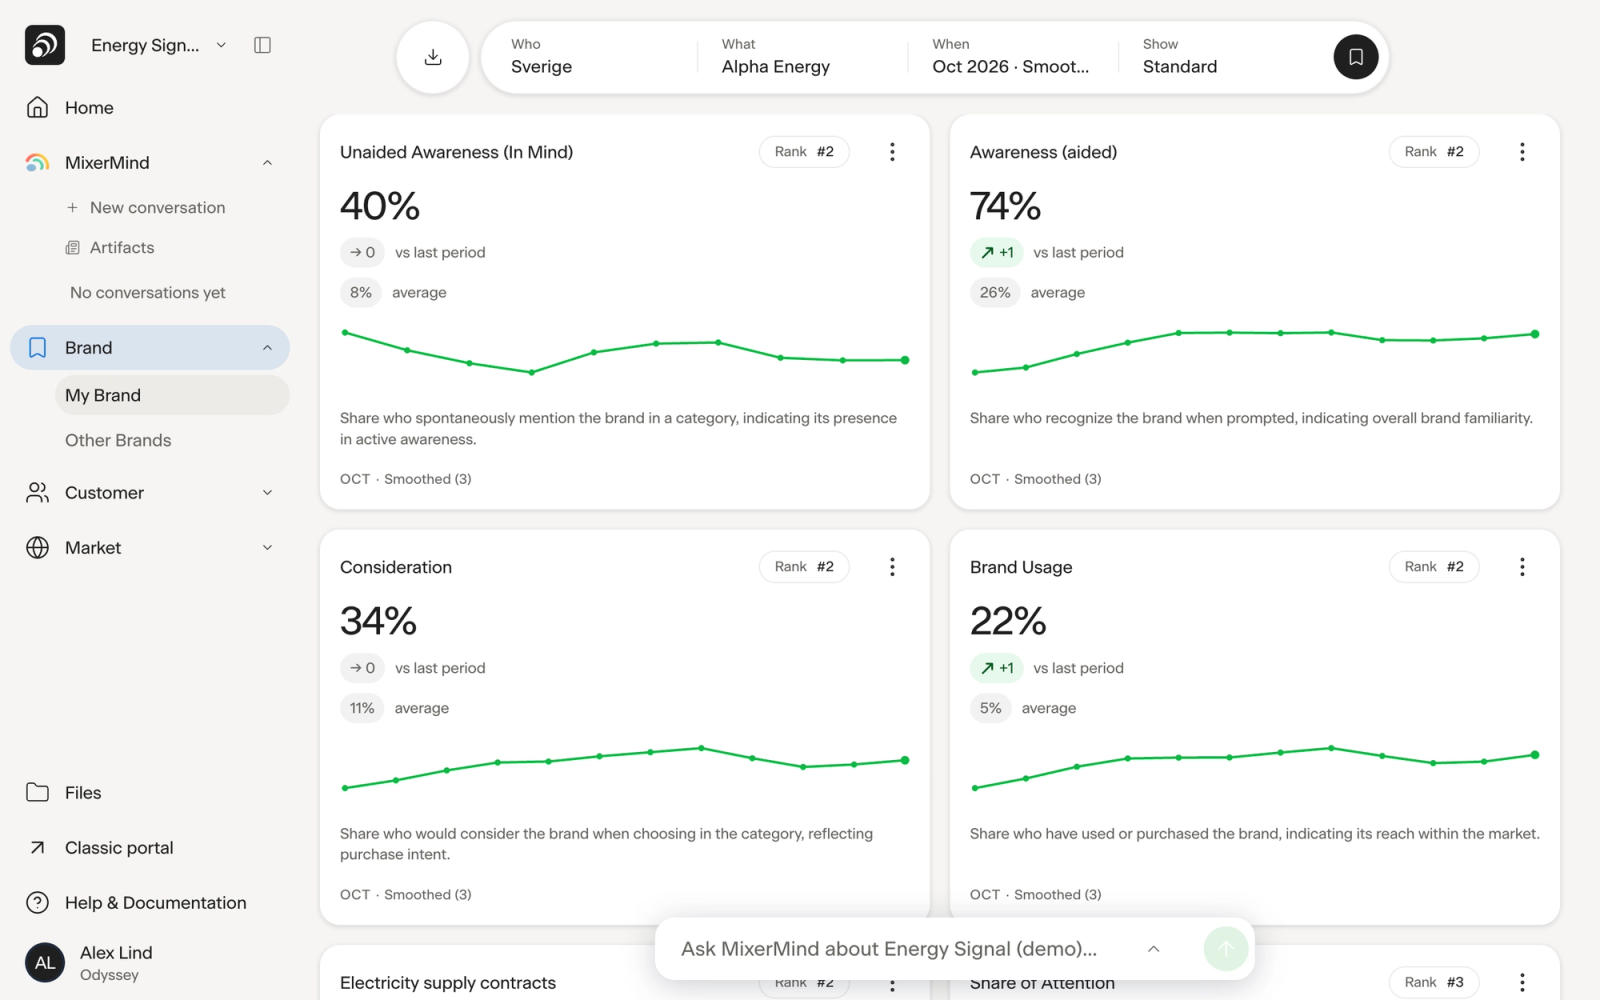
Each widget has a menu (⋮) where you can read about its data and bases, download an image of it or its figures, and pin it to Home. See Dashboards and widgets.
A warning icon on a widget means some of its figures rest on few answers (a low base). Read them with care.
To ask about what you see, use the MixerMind box at the bottom of the page. It knows which page you are on.
Words you are not sure of are explained in the Glossary.
Last reviewed 9 November 2026