Dashboards and widgets
How a Signal's dashboards are built: sections, pages and widgets, the widget menu, bases and low-base warnings, and how changes are shown.
A Signal's dashboards are organised in sections and pages, and each page is made of widgets. Odyssey names the sections and pages when it sets up your Signal, so they differ between Signals.
Sections and pages#
The sections are in the left menu. Select a section to see its pages, and select a page to open it. To give the dashboard more room, collapse the menu with Collapse navigation at its top.
A page with a lock in the menu belongs to a data source your organisation does not have yet. It shows a preview, not your data. To add the data source, contact us.
Widgets#
The filter bar above the widgets (Who, What, When and Show) applies to every widget on the page. See Filters, periods and saved views.
| Widget | What it shows |
|---|---|
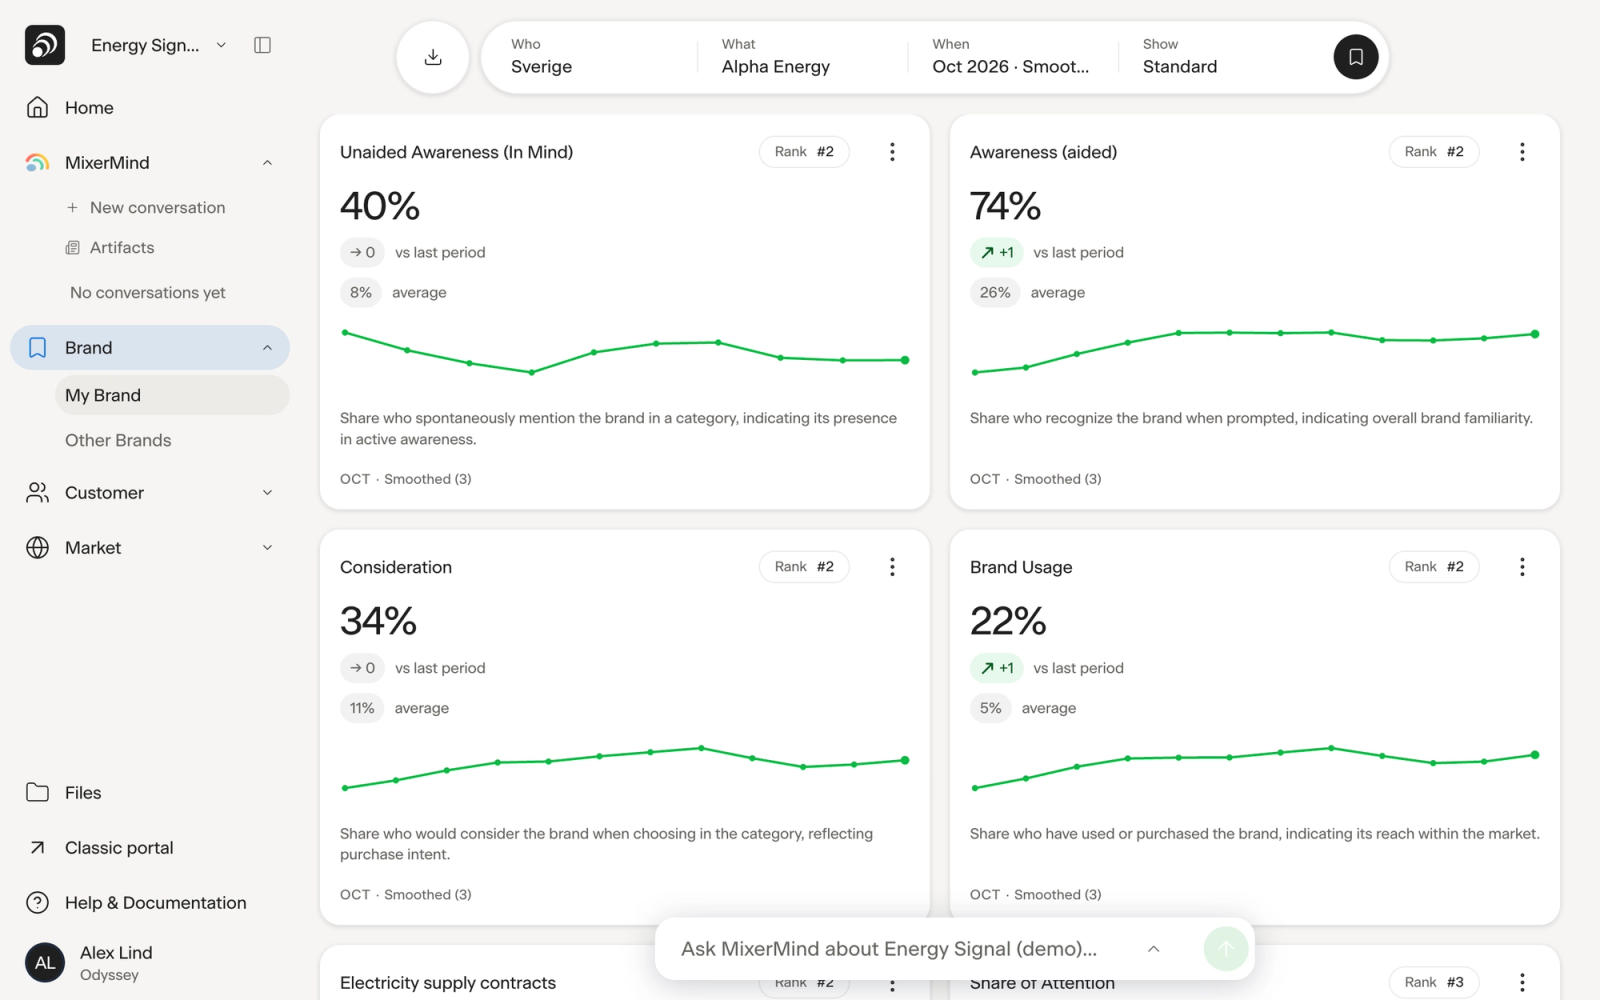
| KPI card | One metric, with the change against the comparison period, a small trend line and your rank in your competitor set. Select the card to open its trend over time. |
| Chart | Lines over time, bars, funnels, donuts and scatter charts. Where a chart has a side panel, select a point to see its details there. |
| Table | Several metrics or brands side by side. |
| Map | Brand positioning: where brands sit in relation to each other and to what buyers look for. |
Some widgets have their own choices in their header, such as which metrics or brands to show. Analyze More (+) opens a widget with more choices for a closer look, and Close Analytics takes it back.
The widget menu#
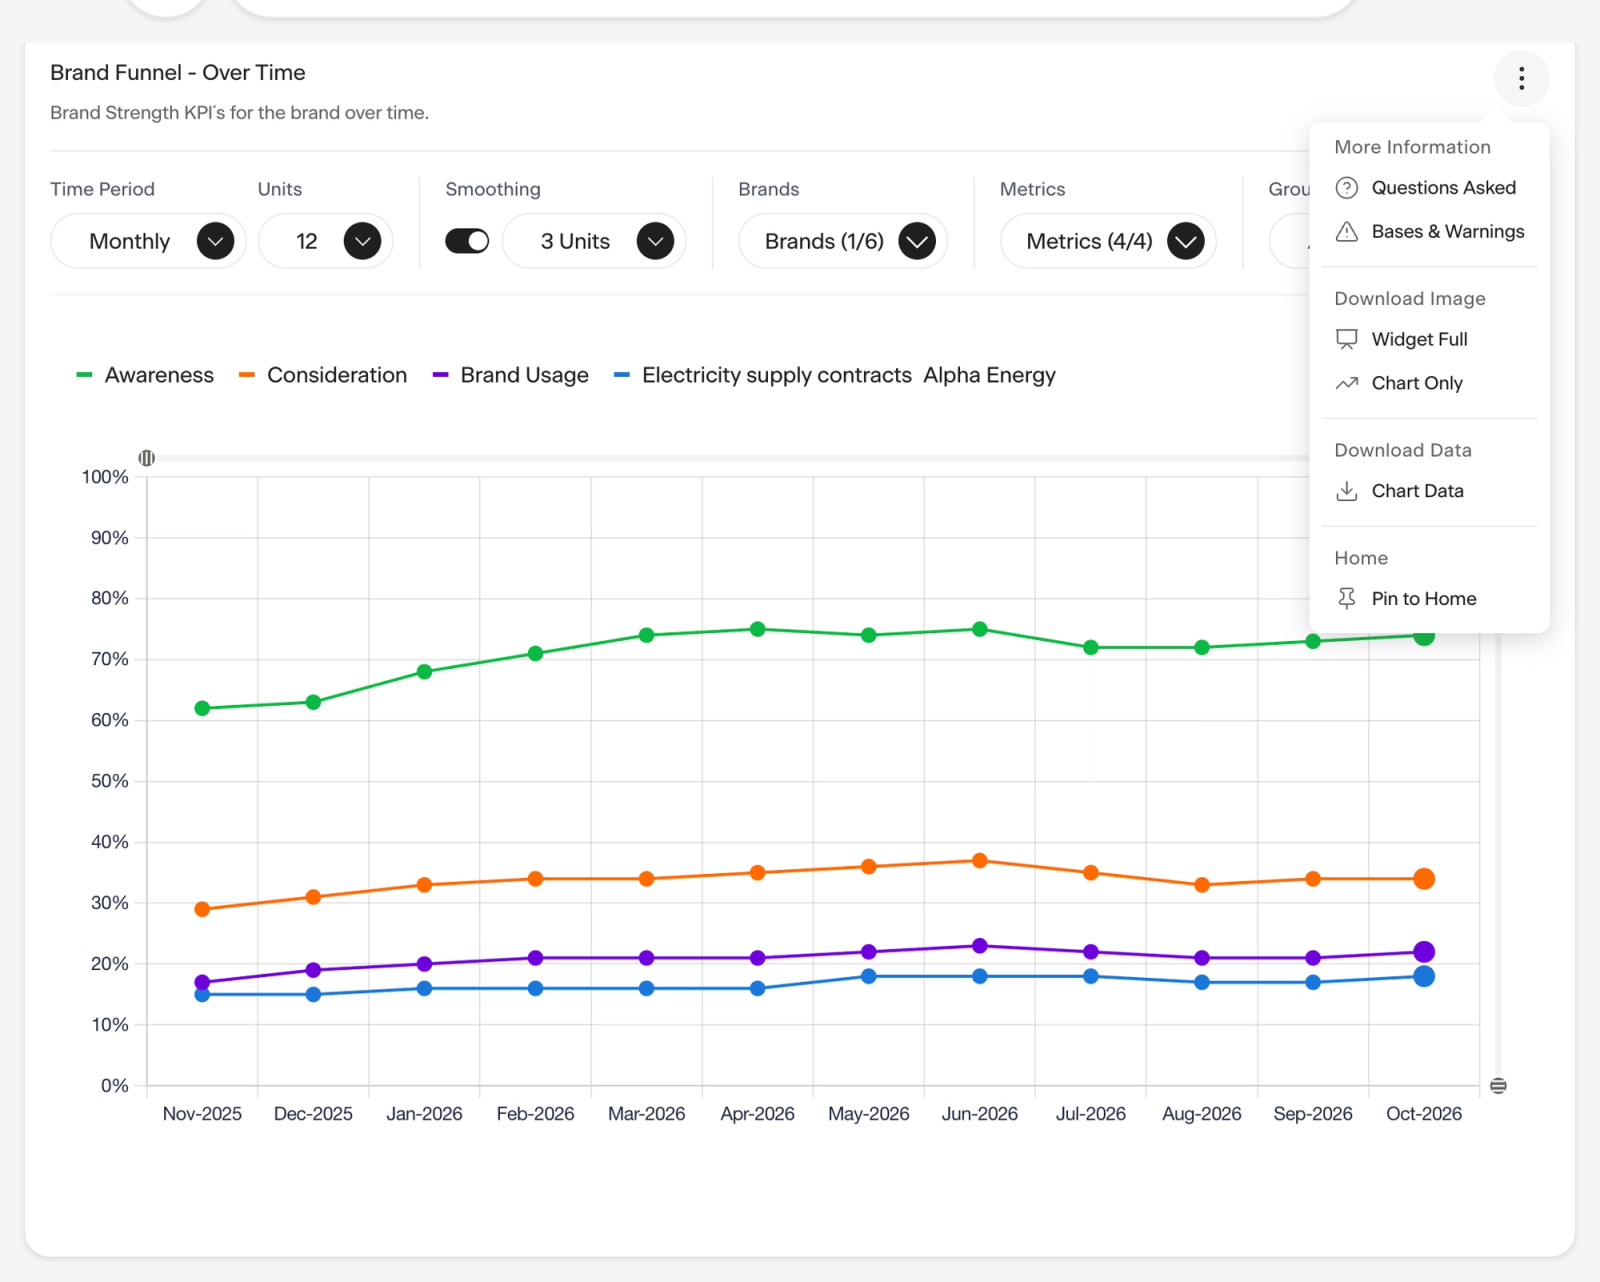
Each widget has a menu (⋮) in its header. What it offers depends on the widget.
| Group | Item | What it does |
|---|---|---|
| More Information | About This Data | What the widget shows and how it is calculated. Only on widgets that have a description. |
| More Information | Questions Asked | The survey questions behind the figures. |
| More Information | Bases & Warnings | The number of answers behind the figures, and which ones are low. |
| Download Image | Widget Full, Chart Only, Table Only, Chart & Info | A PNG image of the whole widget or a part of it. |
| Download Data | Chart Data | The figures as an Excel file. |
| Home | Pin to Home | Adds the widget to your Home page. Unpin from Home removes it. |
Bases and low-base warnings#
The base is the number of answers behind a figure. When some figures on a widget rest on few answers, the widget shows a warning icon. Select it, or choose Bases & Warnings in the widget menu, to see the base range of each metric and the data points with a low or very low base.
Read those figures with care: with few answers, a change can be chance. Narrowing Who to a small segment lowers the base.
Changes and rank#
A KPI card shows the change against the comparison you choose under When, such as the previous period or the same period last year. An arrow with the change marks a change large enough to note: 4 percentage points or more for percentages.
Rank is your brand's place within your competitor set.
On the Visibility pages, changes are tested for significance: a marked change is significant at the 95% level.
When a widget shows no data#
No data for this selection means the measure has no answers for the brand, market and filters you chose in this period. Try an earlier period or fewer filters. If a widget says Couldn't load this chart, select Try again.
Last reviewed 9 November 2026